


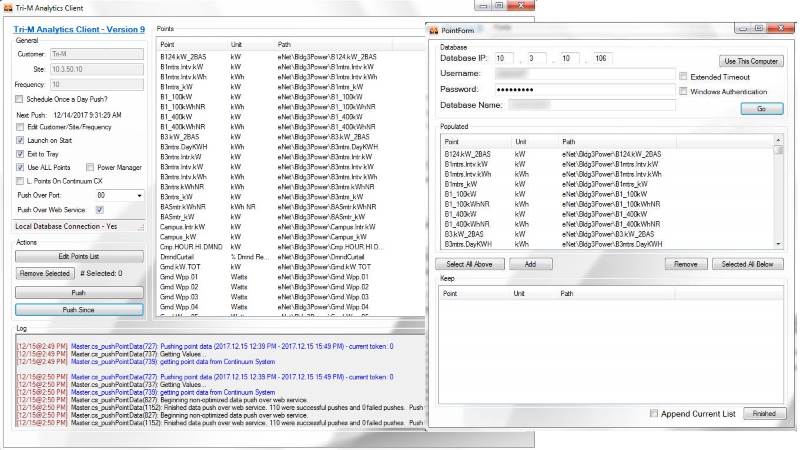
Designed and developed a system used to identify, collect, and schedule batch pushing of logged sensor data. Pushed data was processed and transformed prior to insertion into our cloud database. The program was deployed as a Windows Communication Foundation (WCF) service hosted in a managed Windows Service. This allowed for a highly resilient worker service that pushed data even when a user was not logged into the Windows workstation. The system was capable of collecting data from Microsoft SQL Server, SQLlite, PostgreSQL, and XML datasources.
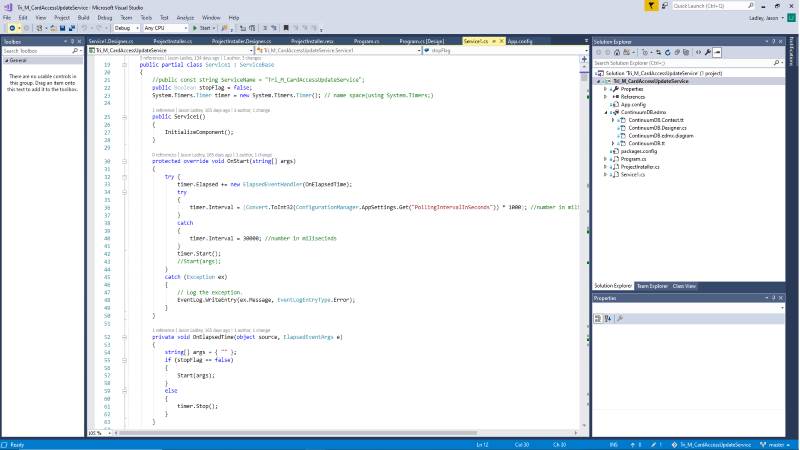
Designed and Developed a system dedicated to parsing data from multiple systems (Banner's student information system, and OneCard's Campus Student ID Card Systems) and committed changes to Continuum using Continuum Report's PDI application. The Windows service created for this task served as an integration layer between several independent systems. The processed updates were used to control building and door proximity card access for all faculty and students.
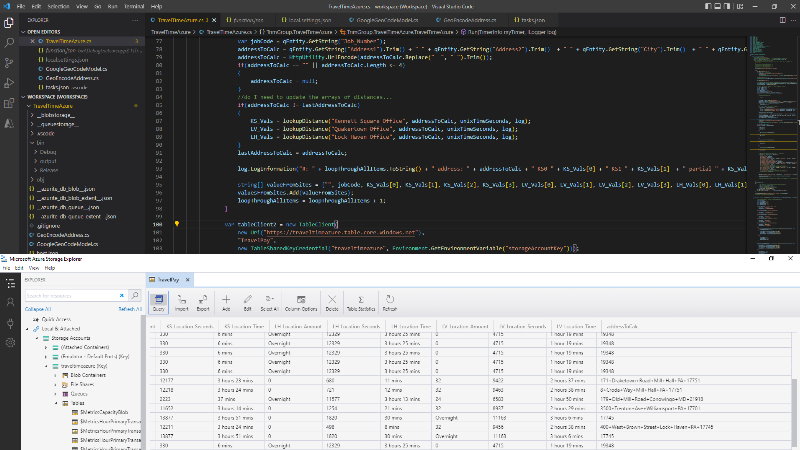
Developed an Azure Function used to calculate employee travel pay reinbursement for jobsite visits. This function ran daily examining all job addresses associated with active job codes for the week. Distance from jobsite locations was calculated for each Tri-M office location using Google Map's API. Based on an employee's designated Tri-M office and charged job codes for the week they recieved travel pay automatically. Data was stored economically in Azure Tables.
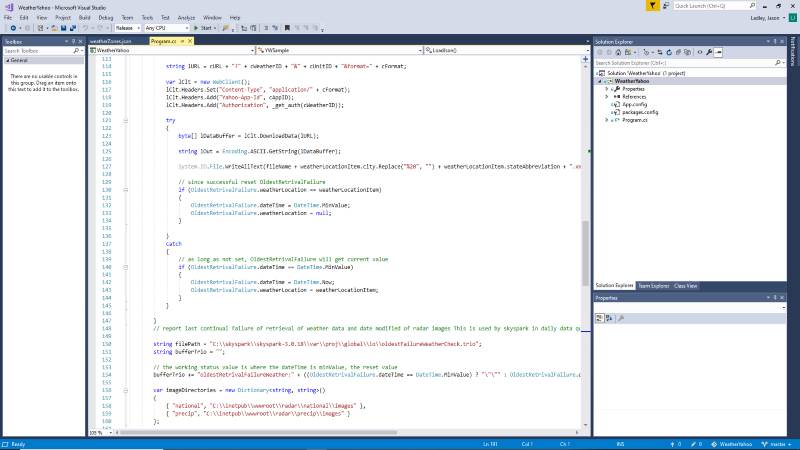
Created a Windows Service dedicated to retrieving weather data using Yahoo's Weather API. The service's health and the datetimes of each location's most recent weather report were sent out via daily emails. The retrieved weather reports were saved to a cloud server in xml format and made accessible for dashboarding purposes.
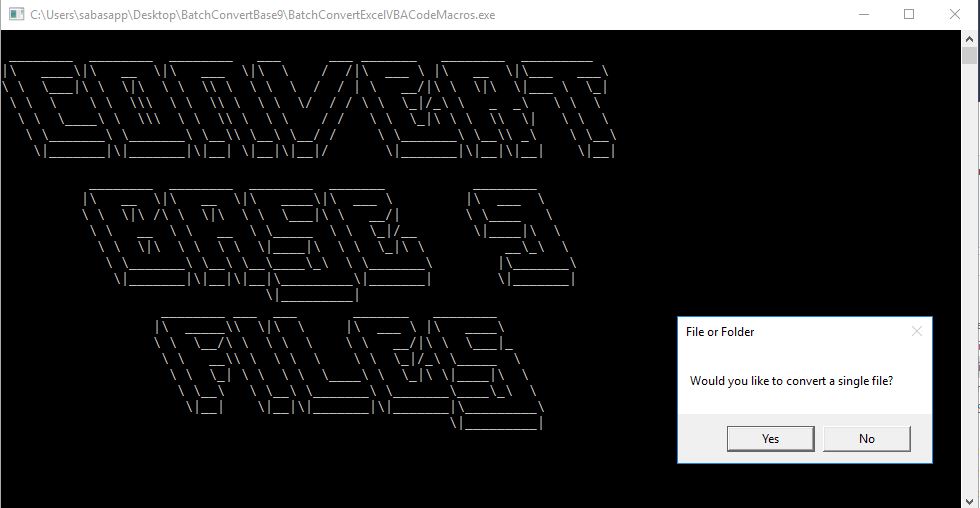
Wrote a simple program that examined and edited 1.3 million excel files on the company's network drives. The program replaced sections of VBA code that were incompatible with Microsoft's 64-bit version of Excel. All changes were logged and reversible.
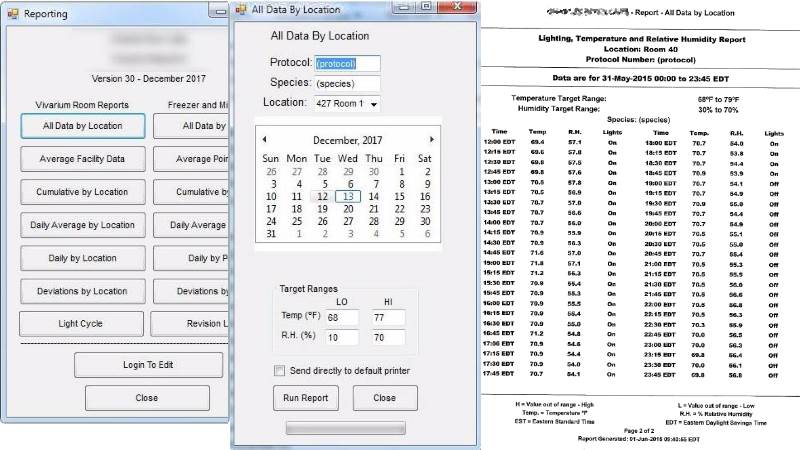
Worked on developing an application used to audit research laboratory room conditions. The application generated a wide range of reports documenting when locations or sensors deviated from their permitted threshold values. Reports could be generated in HTML or PDF format. Reports could also be sent directly to the workstation's default printer once generated. Users could login to add or remove locations and sensors. Users could also configure individual sensor's high and low threshold values.
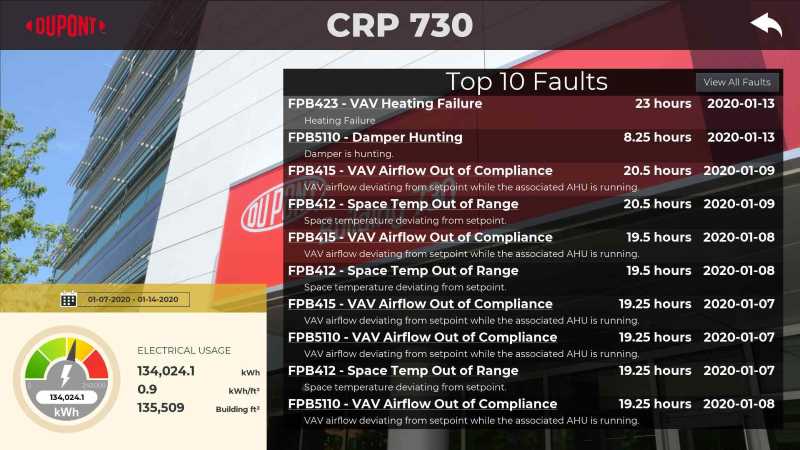
Developed a dashboard to display building specific data to assist continuous commissioning efforts. The dashboard displayed kWh consumption data and a list of high priority faults for a given time frame. The faults identified were spans of time in which the building automation system's operation deviated from its programmed sequence of operations.
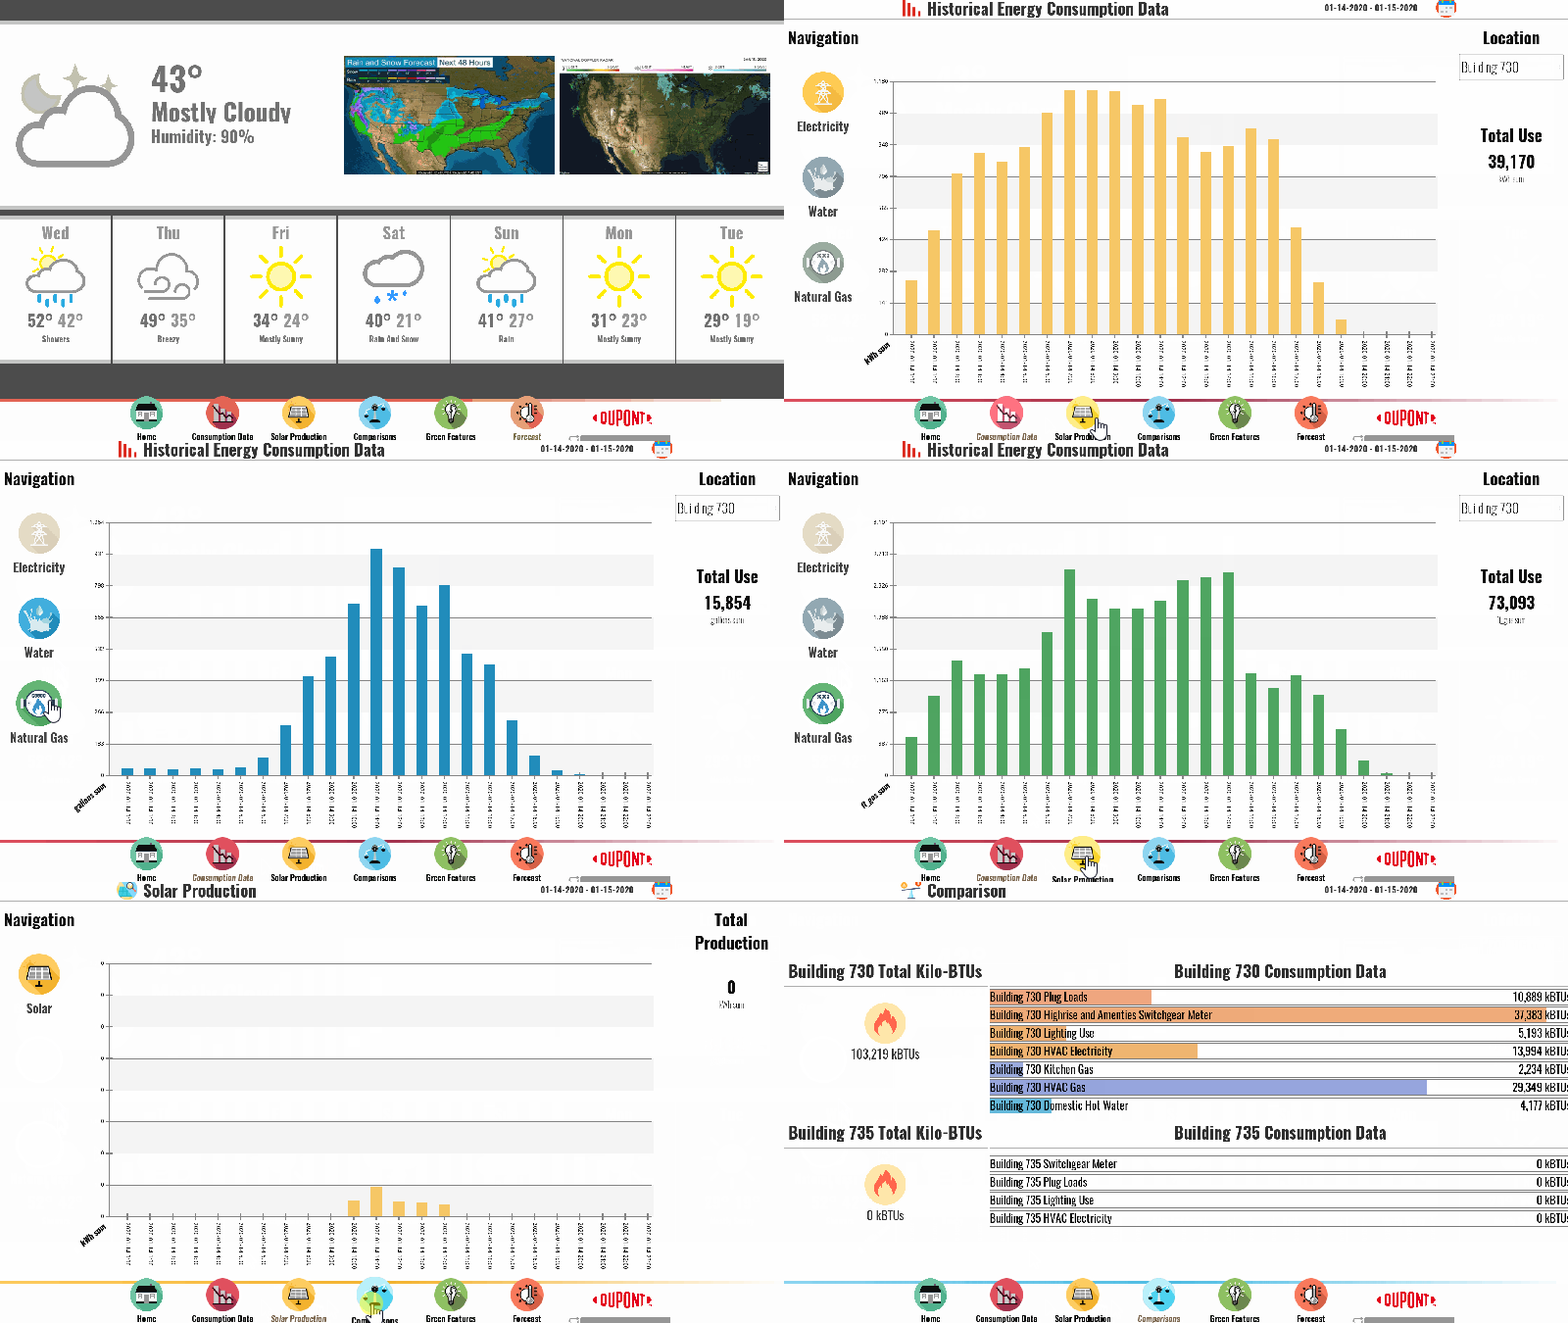
Developed a dashboard to display site wide aggregated energy data. This dashboard was deployed in a corporate lobby and rotates through all screens in a few minutes. In addition to showing energy data the dashboard displays a weather forecast and several screens showcasing the green features of the building.
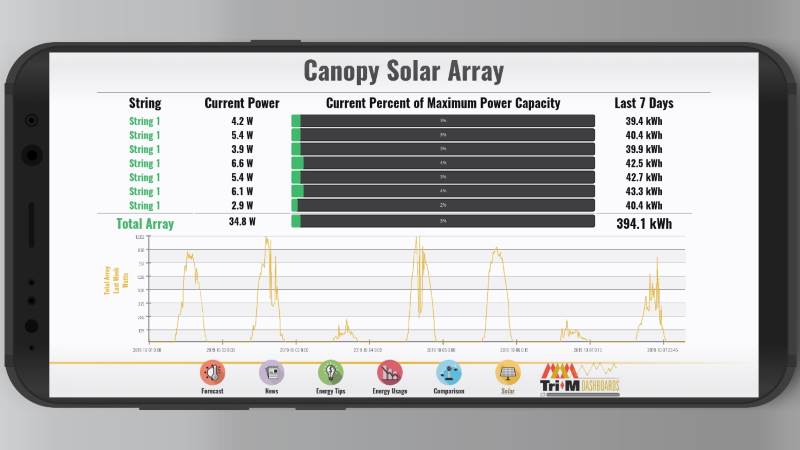
Developed a dashboard for displaying corporate announcements, energy consumption, and solar production data. This dashboard was developed using the Godot 3 game engine. In addition to being displayed in a lobby setting, this dashboard was also deployed to IOS and Android devices.
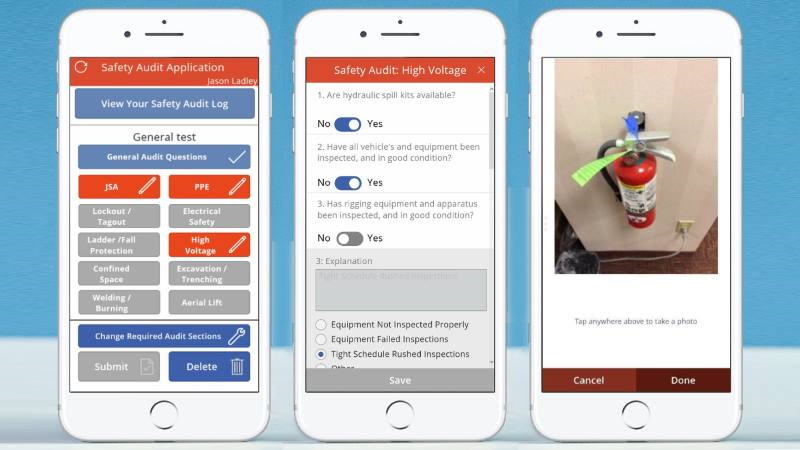
Developed a mobile application to allow workers in the field to complete safety audits. Digitizing the safety audit allowed the company to analyze and identify safety concerns in near realtime. Allowing users to upload photos helped the company document good and bad conditions at customer sites. Sites with a high number of reported issues were prioritized for investigation.
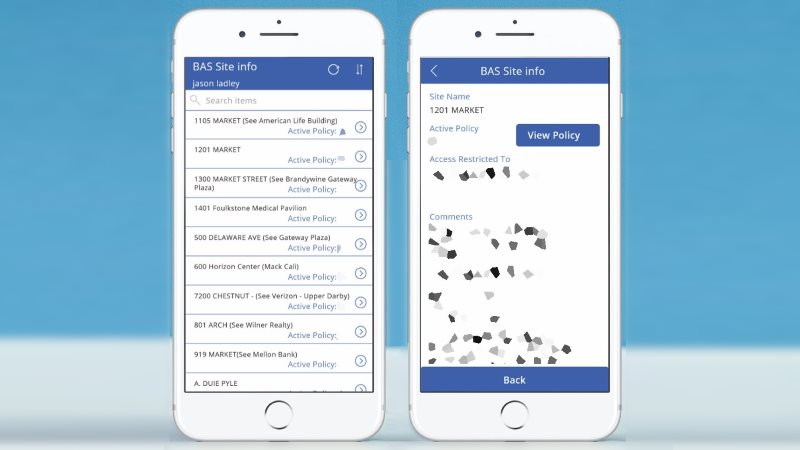
Developed a mobile application that allowed active employees to retrieve passwords for customer sites. Once users authenticated through Office 365 they would be presented with a list of sites. Each site contained unique password policy information and the application allowed administrators to restrict user access on a site by site basis.
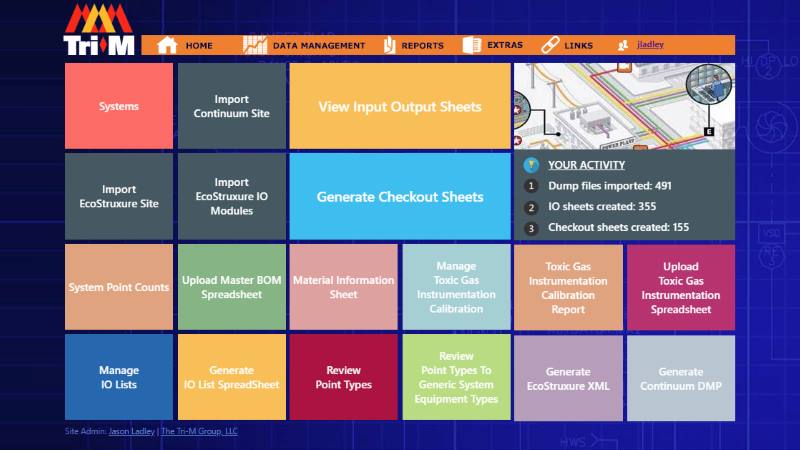
Developed in C# utilizing the MVC framework. This application assisted Engineers, Estimators, and Project Managers by generating documentation. In operation for over 9 years, the BASApp has saved countless hours of documentation. The BASApp also served as a data pipeline for each phase of the building automation system project lifecycle. Data entered during project estimating was exportable as a dmp or xml file for Continuum and EcoStruxure systems as the starting point for the engineering department's projects.
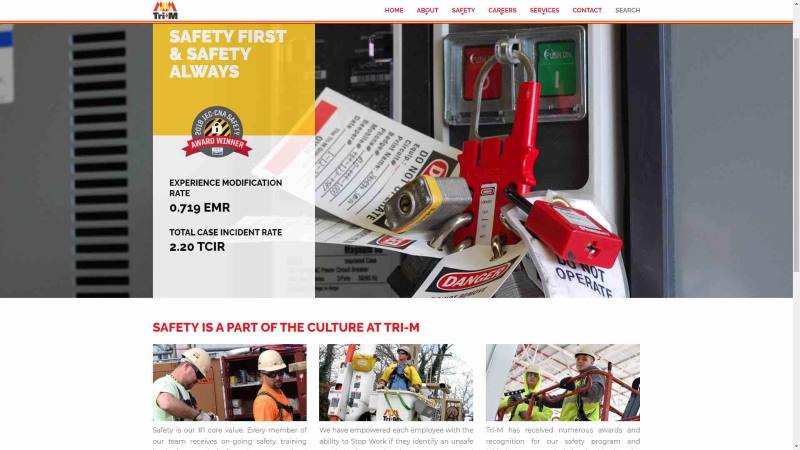
Redesigned in 2017 as a mobile friendly website using C# and the MVC framework integrated with the Umbraco CMS. In addition to simple pages promoting each business unit, there were also pages with custom backend integration. For example, there was integration with BambooHR for job postings, integration with LinkedIn for social media, custom code for registering for on-site customer training, and custom code for the "Contact Us" page.

Redesigned in 2018 as a mobile friendly website using C# and the MVC framework integrated with the Umbraco CMS. Due to the size of the business, this website was built with more of a one page layout in mind. There was backend integration with BambooHR for job postings, integration with LinkedIn for social media, and custom code for the "Contact Us" page.
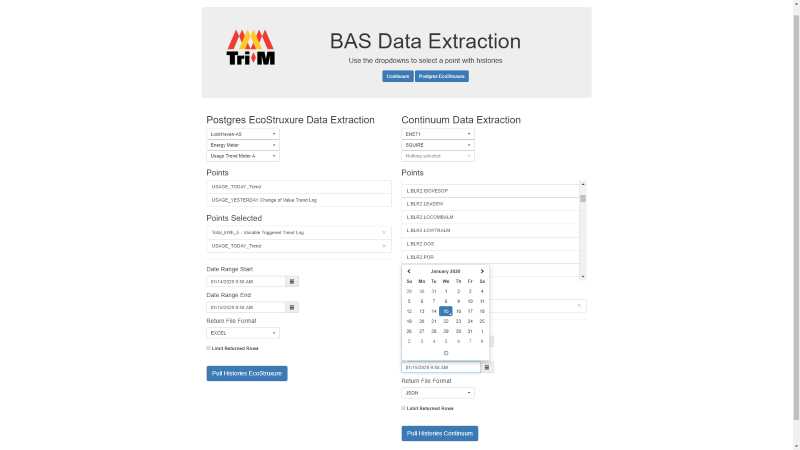
This web application integrated with multiple views and procedures to extract data from a variety of sources. For example: Continuum, PME, EcoStruxure SQL Server, EcoStruxure TimeScaleDB, EcoStruxure Security Expert, and ResidentGaurd systems. In some cases data was joined between different database engines like Microsoft SQL Server and PostgreSQL on demand. Data was returned to the user in either PDF, Excel, CSV, or JSON format.
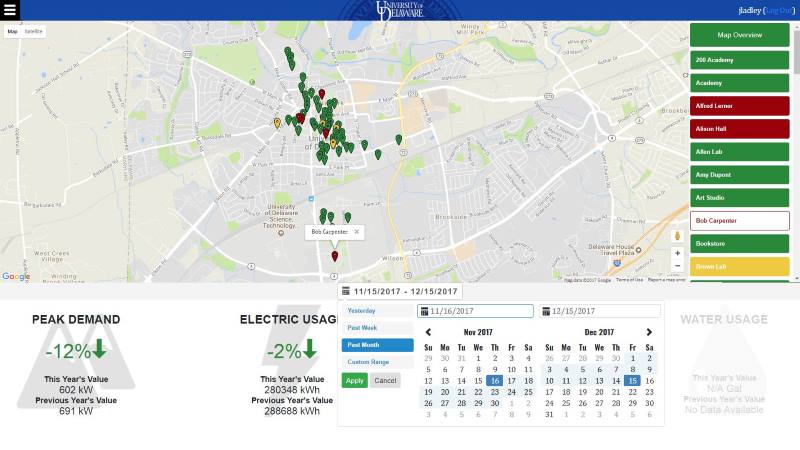
Developed an interactive web portal integrated with the SkySpark analytics engine. This web portal displayed energy consumption and equipment deviation data. The landing page integrated with Google maps to show buildings with energy performance issues at a glance. Year over year performance data was also displayed to show performance trends. The web portal also displayed deeper insights like a list ranking of improperly performing equipment by its estimated cost to the customer.

Created a wordpress website for a local business that provides hands-on exeperience rich classes for children and parents. The website was integrated with a ticket sales platform called TicketTailor to facilitate the sale of class tickets. Collaborated with the business owner on website design and the implementation of ad-hoc features.
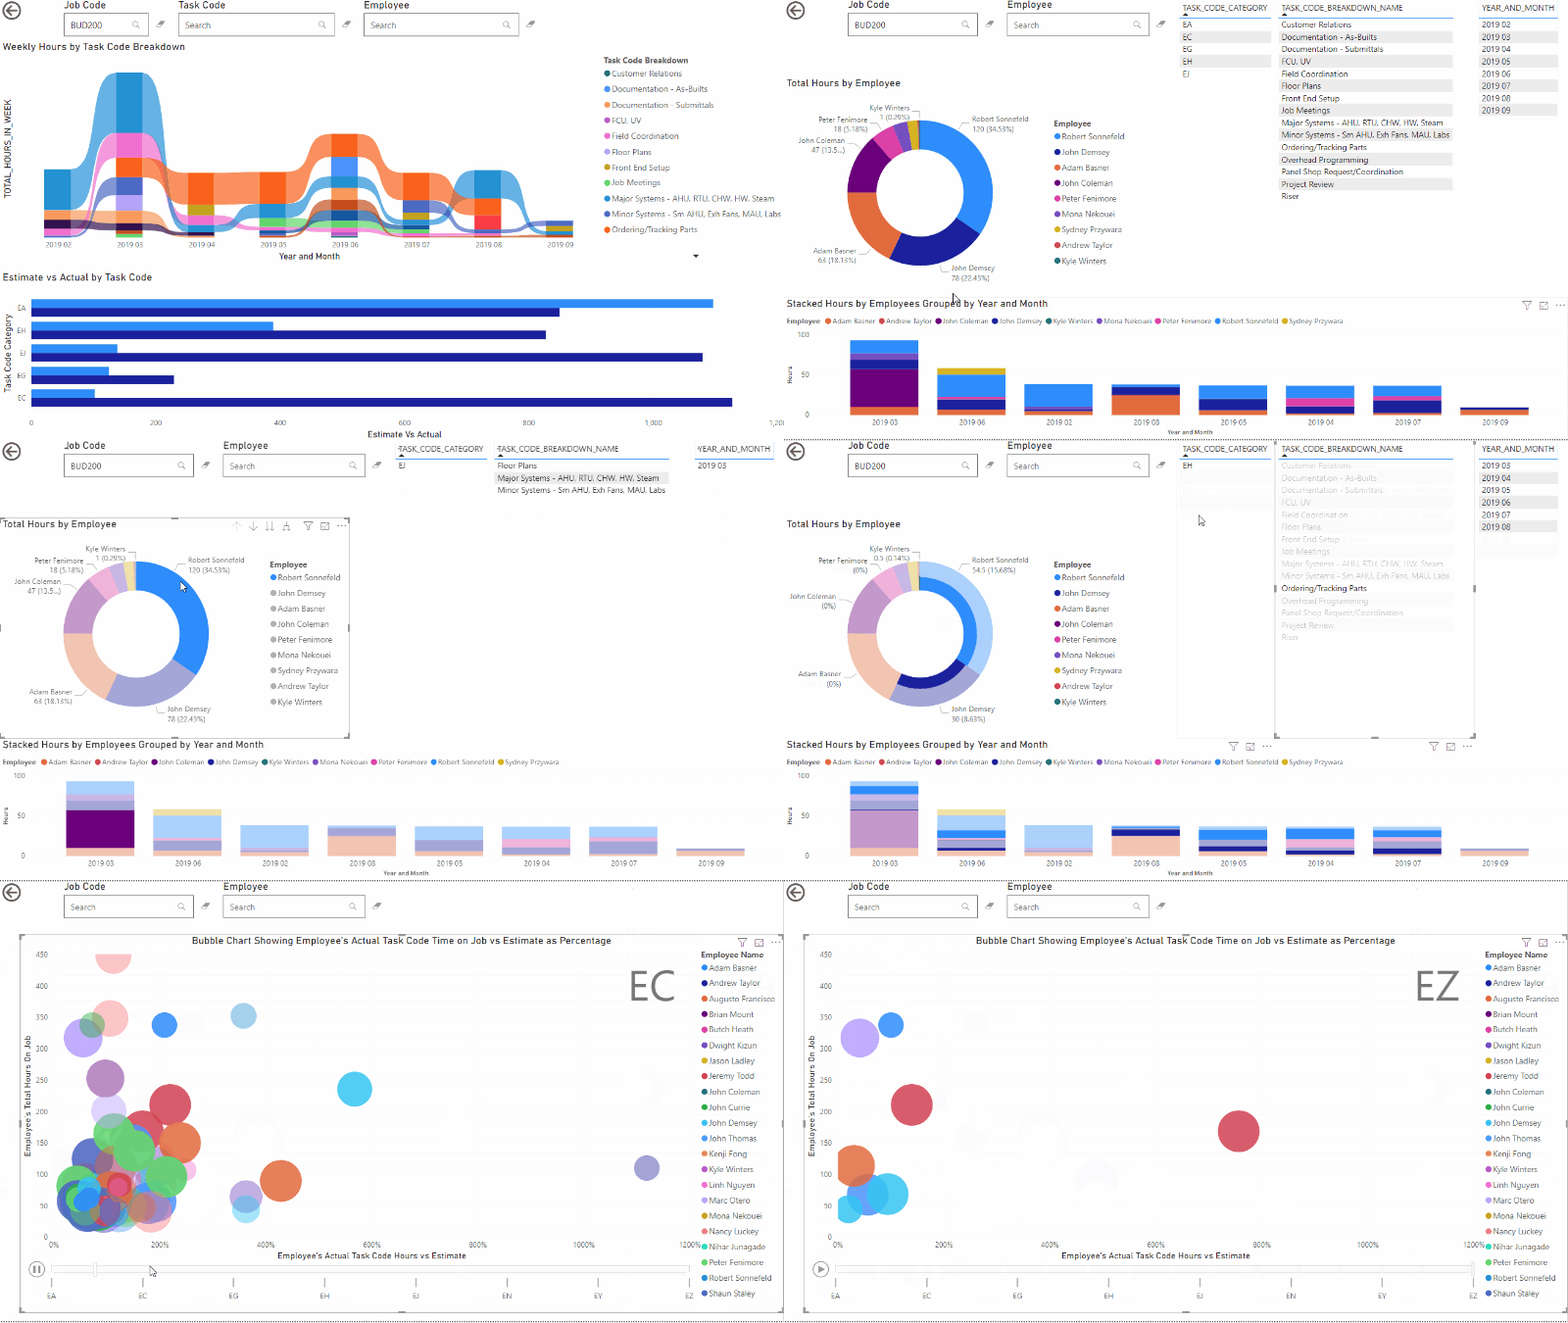
Constructed a dynamic report to display employee charged time on tasks against job estimates for those tasks. Multiple tabs provided several different views for management to review. Worked closely with management to understand their needs and objectives. Wrote SQL views to merge data from multiple datasources into one common report.
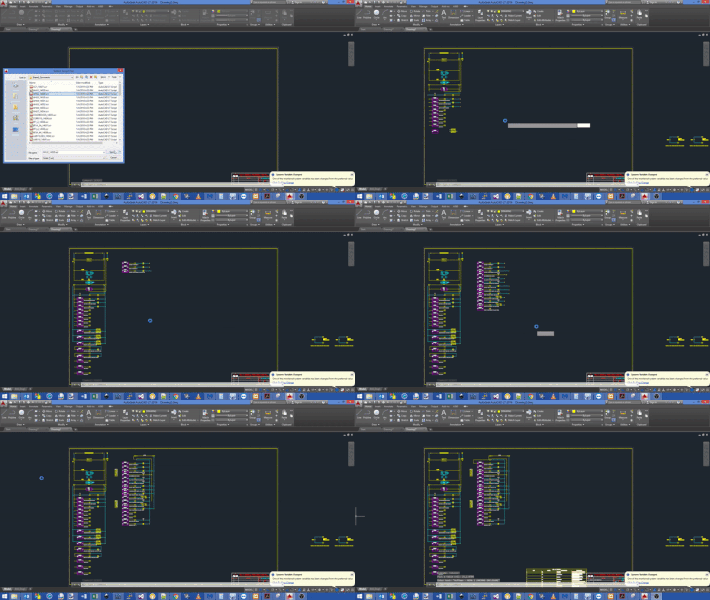
Developed a system to generate native AutoCad draw commands from imported facility control system exports. The ladder diagram drawn was snapped to a grid and written using AutoCad blocks and line drawing commands. Bill of material information could also be printed at this time from data that was previously imported into the system.
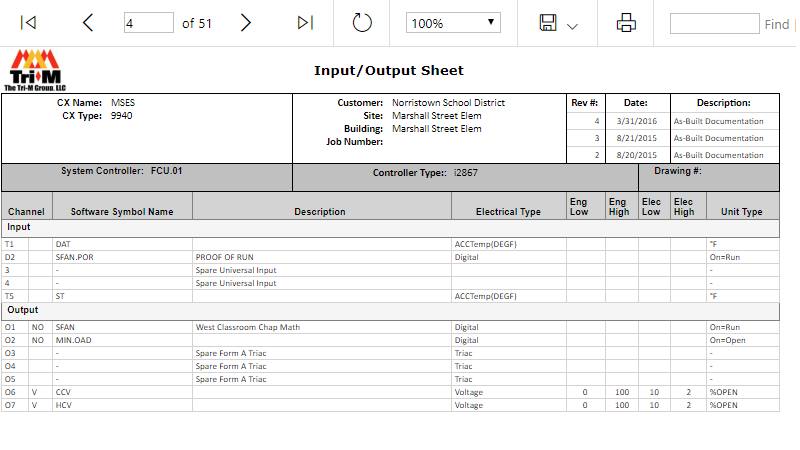
Generated reports from a SQL Server datasource using SQL Server Reporting Services. Reports generated assisted the Engineers, Estimators, and Project Managers in their documentation. Roughly forty reports were created for various departments. Most reports displayed tabular data formatted for printing in ANSI Letter or Ledger format.
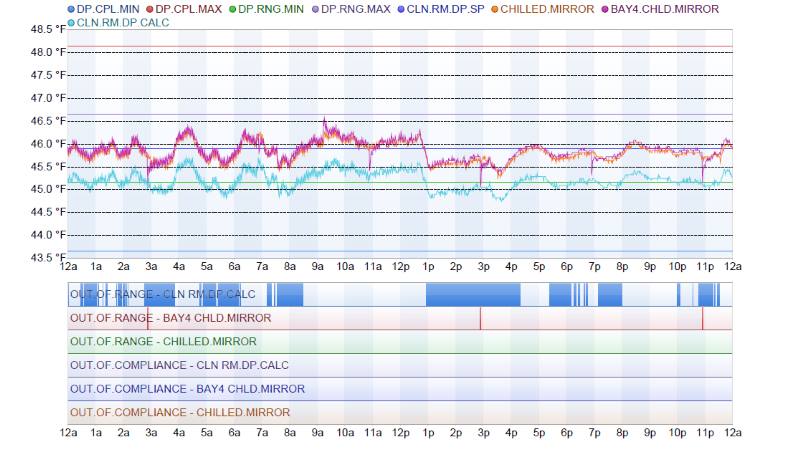
Generated several daily digest reports for SkySpark to assist Facility Managers in their review of critical sensor data. Reports also commonly contained simple KPI measures and fault lists. The SkySpark analytics engine was well suited for the processing of large amounts of historical data to catch trends and drifts in system performance over time.
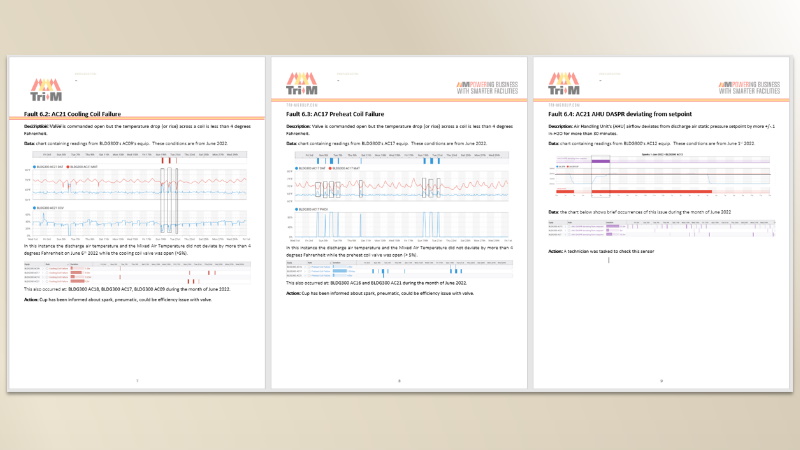
Generated several daily digest reports for SkySpark to assist Facility Managers in their review of critical sensor data. Reports also commonly contained simple KPI measures and fault lists. The SkySpark analytics engine was well suited for the processing of large amounts of historical data to catch trends and drifts in system performance over time.